12 Jun 2026
Performance dashboard
We've added a more detailed performance dashboard, so you can see how well Skwiz processes your documents and where there is room for improvement.
You can find it under Settings > Organization > Performance. It opens on the results for the past 4 weeks, and you can pick a different date range. The dashboard has four tabs.
Overview
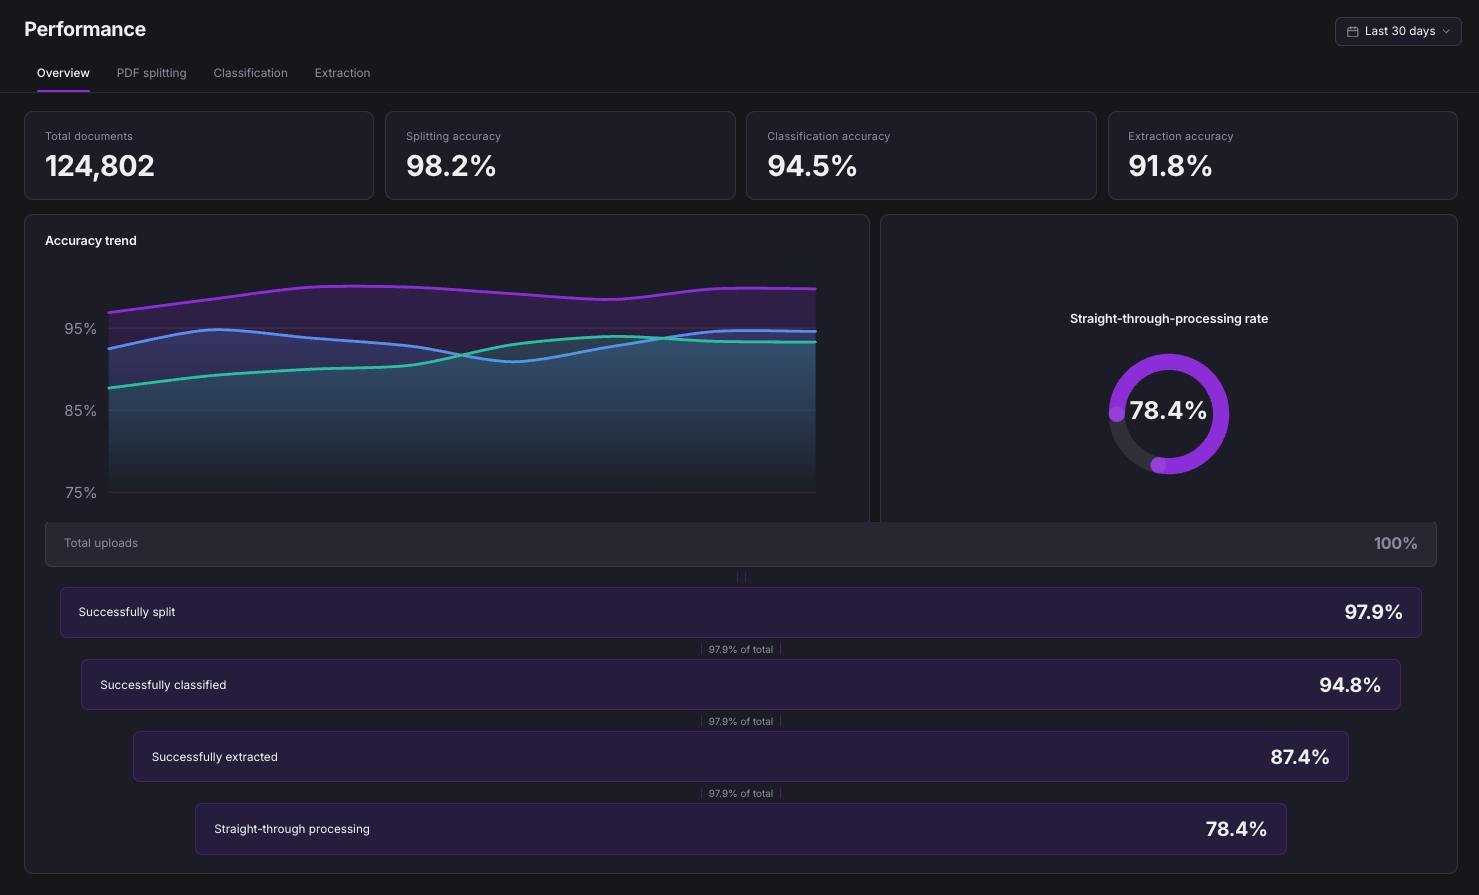
The Overview tab shows the accuracy of splitting, classification and extraction, with a trend line for each. It also shows your straight-through processing rate and a funnel that follows your documents step by step: uploaded, correctly split, correctly classified, correctly extracted and processed straight through without human review.
PDF splitting
The PDF splitting tab shows how many documents were split correctly. Incorrect splits are broken down into under-splits (documents that should have been separated) and over-splits (documents that were split too much). You can see the trend over time and the results per document type.
Classification
The Classification tab shows the accuracy per document type and over time. A confusion matrix compares predicted and actual document types, so you can see which types get mixed up. This helps you decide where to improve document type descriptions, or where keyword or layout matching would help.
Extraction
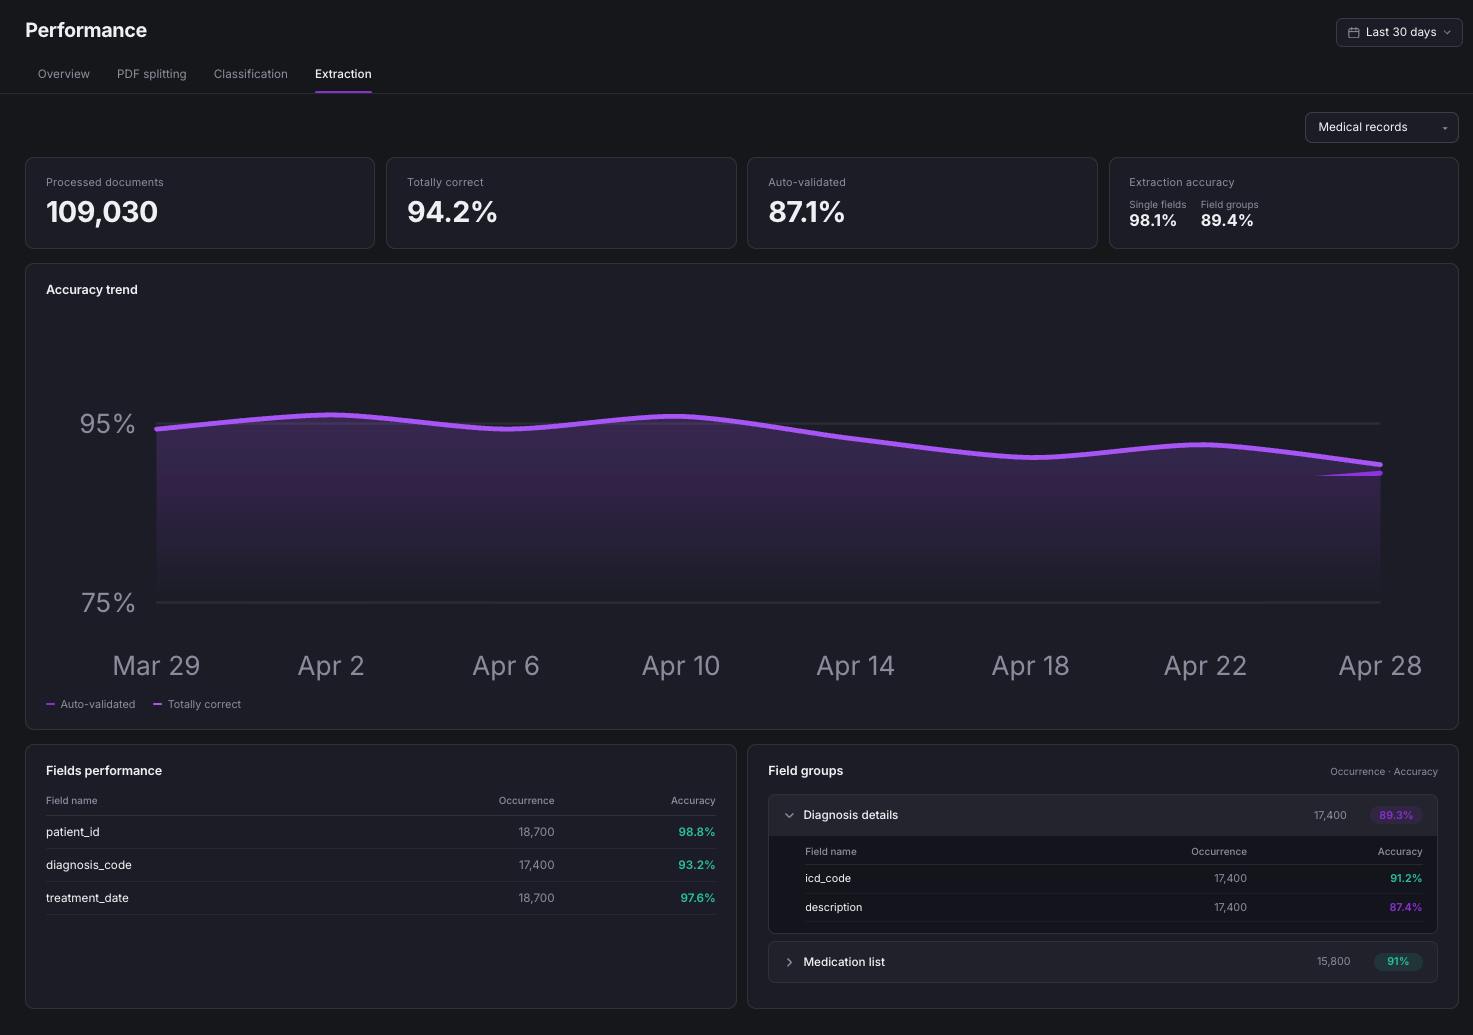
The Extraction tab shows overall extraction accuracy, the share of documents extracted fully correctly and the share that was auto-validated. Select a document type to see the accuracy of each field and field group. This makes it easy to see which fields need clearer instructions or examples for continuous learning.